
- Home
- Live Blog
- Breaking News
- Top Headlines
- Cities
- NE News
- Sentinel Media
- Sports
- Education
- Jobs
Udayan Hazarika
(The writer can be reached at udayanhazarika@hotmail.com)
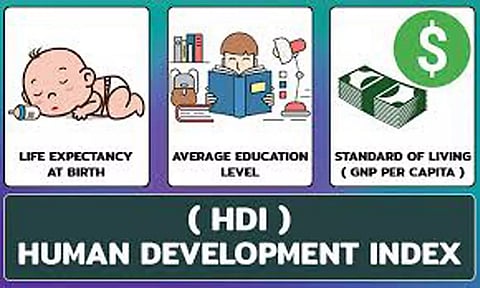
Some 30 years back when the UNDP first came up with the concept of Human Development Index (HDI) in 1990, the world nations took interest in learning the tit bits of method of calculation and the areas of its concern. Governments across the globe showed their awareness towards need for achieving higher targets and attempted to come up the ladder as much as possible. But over the years this interest has depleted. Working with HDI was initially a simple index concerning mainly three dimensions viz long and healthy life, knowledge and a decent standard of living. For the purpose of calculation of HDI, the indicators taken were life expectancy at birth, expected years of schooling and mean years of schooling and gross national income per capita. Thus, HDI actually has been a composite index giving average achievement in three basic dimensions of human development. Further researches on the HDI have resulted in introduction of four adjustable factors to the HDI separately giving four adjusted HDIs. These four indices are i) inequality adjusted HDI (IHDI), ii) gender development index (GDI), iii) gender inequality index and multi dimensional poverty index for developing countries.
For the purpose of ranking, the countries of the world (a total of 189 countries) have been classified into four development groups i.e. the level 0.00-0.54 is marked as low human development group, from 0.54 to 0.69 is categorised as medium human development group, from 0.70 to 0.79 has been marked as high human development group and finally from 0.80 to 01 is categorised as very high human development group. So far, no country in the world has achieved the HDI of value 01. As per the calculated HDI for the year 2019, Norway with index 0.957 which is nearing 01 occupies the top position. This is followed by Ireland (0.955), Switzerland (0.955), Hong Kong (China) (0.949). Hong Kong is the first and the only Asian country to occupy a single digit rank in the list. Even Singapore and Japan have been ranked at 11th and 19th position respectively. Of the countries of Indian subcontinent, Sri Lanka occupies the best position of 72 with index 0.782. India has gone down from its earlier position of 130 to the rank of 131 with index of 0.645 and falls within medium human development group. Other countries of this region namely Bhutan (129), Bangladesh (133) Nepal (142), Pakistan (154) all are in the same group. The African country Niger has been ranked at 189th position with index at 0.394.
The present indices are prepared on the basis of four SDG parameters namely life Expectancy at birth (SDG-3), expected years of schooling (SDG-4.3) mean years of schooling (SDG-4.4), gross national income per capita ( SDG-8.5). India's life expectancy at birth (69.7 years) is lower than Bhutan (71.8 years), Bangladesh (72.6 years) and Nepal (70.8). This is despite the fact that Bangladesh and Nepal both have lower per capita income than India. India has not performed well in respect of SDG-3. Poor and unbalanced socio-economic growth leading to malnutrition of mothers and newborn, never ending menace of non institutionalised births, poor breast feeding, illiteracy leading to low degree of immunisation, etc are the major reasons of low life expectancy.
Similarly, mean years of schooling which is another indicator is very low in India. This indicates the average number of completed years of education of a country's population aged 25 years and older, excluding years spent repeating individual grades. While mean years of schooling in India is only 6.5, it is 12.9 in case of Norway. It is 10.6 in Sri Lanka, 8.1 in china, and 6.2 in Bangladesh. This is another indicator which is responsible for pulling down India's ranking. Per capita GNI for India is estimated at $6681 while it is $10746 for Bhutan, $ 16057 for China and $12707 for Sri Lanka. However, if the ranking had been done by GNI Per capita, India's position would have been 126 instead of 131. Similarly, Bhutan's position would have been 108 instead of 129 and China would have ranked at74th instead of 85th rank.
As regards inequality adjusted HDI i.e. (IHDI), the top position remained with Norway with index value at 0.899 while India remained at 130th rank with index value at 0.475. Sri Lanka with a far better index value remained at position 71st and China at 86th position. This proves that India needs a systematic intervention in this area. Despite having better ranking by means of GNI per capita, severe inequality persists in India which is worse than many poor countries of the world. GDP growth should not simply be the ultimate target of a country. GDP's growth impact must also cover the poor in terms of their income, education and health.
India has fared poorly in respect of gender development index too. The gap is dangerously wide and open in respect of distribution of per capita GNI which is $10702 for males and only $2331 for females. NITI Aayog perhaps needs more attention to assess the degree of democracy prevailed in this area.
The UNDP has now forwarded a proposal to construct a new index to adjust the HDI for planetary pressures (PHDI). For the planetary pressure, it is proposed to use the indicators of i) greenhouse emissions and ii) material footprint. The report states that a "country's material footprint measures the amount of material extracted (biomass, fossil fuels, metal ores and non-metal ores) to meet domestic final demand for goods and services, regardless of where extraction occurs. It is a consumption-based measure that accounts for international trade. It also indicates pressures on the biosphere exerted by socioeconomic activities, since it includes the use of biomass —thus indirectly reflecting impacts of actions such as land use change on the loss of biosphere integrity". Depending on the values, the UNDP has estimated the planetary pressure adjusted Human Development Index (PHDI). It implies that if a country puts no pressure on the planet, its PHDI and HDI would be equal, but the PHDI falls below the HDI as pressure rises. The adjustment factor is calculated as the arithmetic mean of indices measuring carbon dioxide emissions per capita, which speaks to the energy transition away from fossil fuels, and material footprint per capita, which relates to closing material cycles. As per the calculated value, India's PHDI is 0.626 which is lesser than the HDI indicating thereby that India has been exerting pressure on the planet. Had the ranking been done on the basis of PHDI, India's position would have gone down to 139th rank. Almost all the Asian countries performing badly in this area.
A look at the trends of the growth of HDI in India over the years will reveal that the rate is falling sharply since 2010. The rate of growth during 1990 and 2000 was 15 per cent which rose to 17 per cent during 2000 and 2010; a fall in the growth was registered from 2010-2015, during which it rose by 07.77 per cent but an unprecedented fall in growth could be seen between 2015 and 2019 when growth was only to the tune of 3.37 per cent. As almost all the parameters of HDI are linked to SDGs, and that NITI has exclusive jurisdiction over SDG there is scope to believe that either NITI is having more democracy or the Ministries - which are leaving everything to happen automatically or forcefully and in neither case it is working. As citizens are stakeholders to all the SDGs they are to be sensitised not pressurised. If citizens cannot decide, they may be guided even if they cannot decide it implies that they are not ready to it now. The process to be made afresh and that is democracy- neither more nor less- imposition only indicates autocracy.
